Video
Definition
Cardiac output (CO) is defined as the amount of blood pumped through the heart in one minute.
In a healthy person cardiac output primarily is a function of metabolic demands. The greater the metabolic demand the greater cardiac output needs to be to meet those demands.
Cardiac output is most often specified as the amount of blood pumped through the left ventricle in one minute. This is measured as Liters per minute (L/min). On average, at rest, this is 5 L/min, but may vary from <5 L/min to 35 L/min depending upon disease state or metabolic demands (King & Lowery, 2023).
Cardiac output is the product of stroke volume (SV) and heart rate (BPM). This means cardiac output can either be increased or decreased by altering stroke volume and/or heart rate. Understanding this is one of the most important clinical aspects of cardiac output which we will consider in the Clinical Significance portion of this article.
Stroke Volume
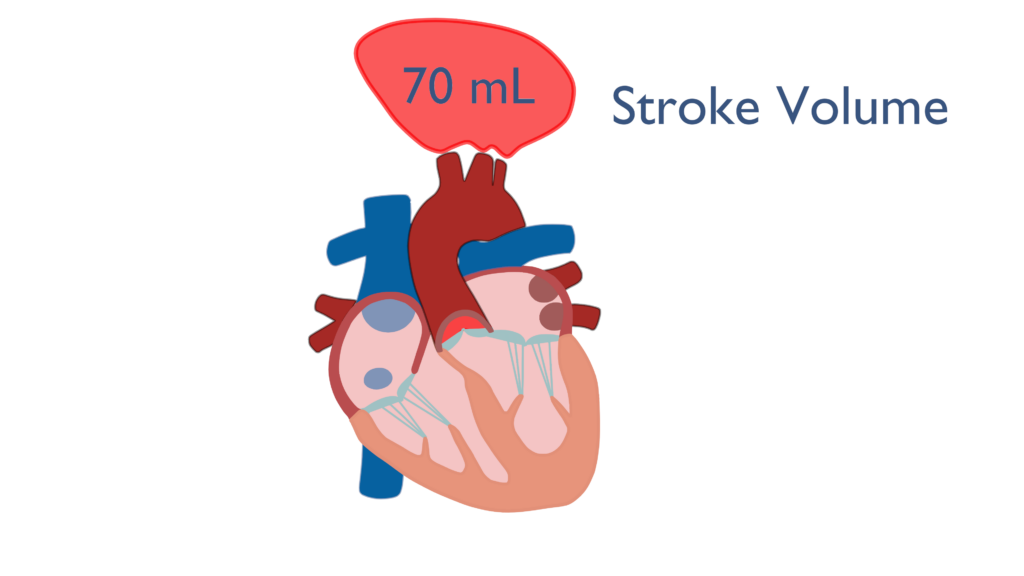
Stroke volume (SV) is defined as the amount of blood ejected from the ventricle with each beat. The average stroke volume for a human heart is 70 milliliters (mL) or 0.07 Liters (L). Stroke volume is a factor of three different variables which are contractility, preload, and afterload (King & Lowery, 2023).
Contractility
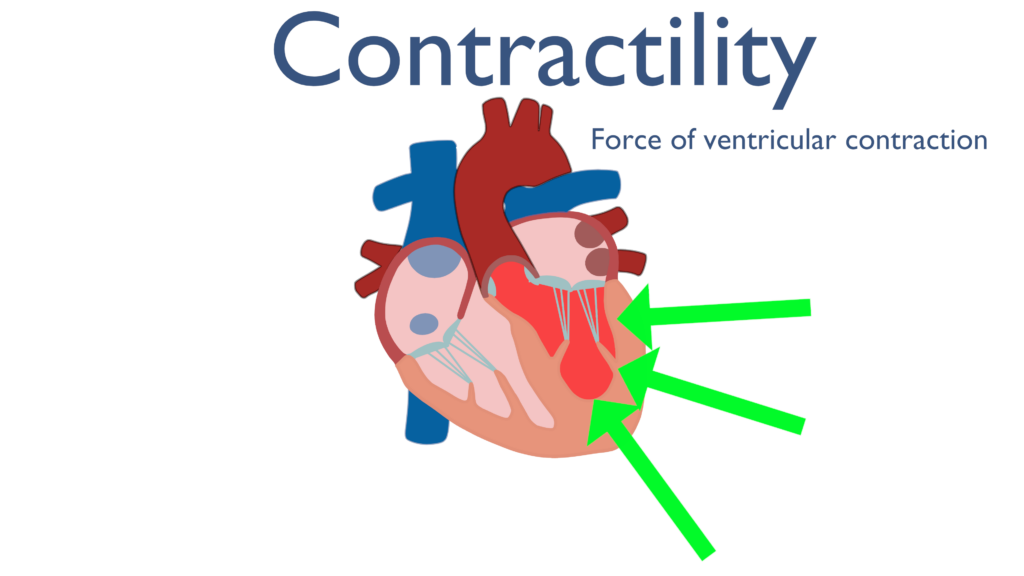
Contractility describes ventricular contraction forces. The greater the force of contraction of the ventricle the greater the amount of blood ejected will be.
Contractility has a direct relationship with stroke volume. This is to say that when contractility increases stroke volume will increase. This is because an increase in the force the ventricle is contracting with will increase the amount of blood ejected from the ventricle.
Preload
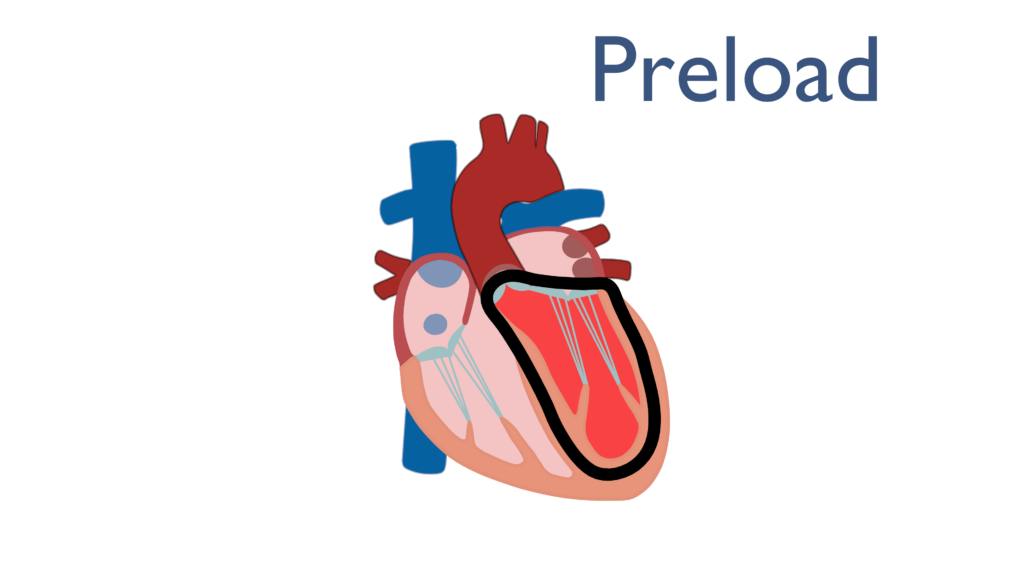
Preload is an overarching term used to represent multiple factors related to ventricular myocyte tension while the heart is at rest. Norton (2001) describes preload as “all of the factors that contribute to passive muscle tension in the muscles at rest.”
Most often preload is used synonymously with end diastolic volume (EDV) which is defined as the amount of blood in the ventricle at the end of diastole. Since diastole begins with the closing of the semilunar valves and ends with the closing of the cuspid valves, the summation of all factors causing tension in the ventricles are present at the end of diastole. This shows the we may use these two terms interchangeably.
*End Diastolic Volume
Lets reconsider something real quick. Think of blood pressure. When taking a blood pressure we look at systole and diastole. Systolic pressure is the pressure exerted on arteries as blood is being pushed throughout the body. Diastolic pressure is the resting pressure of the arteries.
Now consider this with respect to heart contraction. Systole is when the ventricles are contracting causing an increase in systemic pressure, which is from the beginning of ventricular contraction to the closing of the semilunar valves.
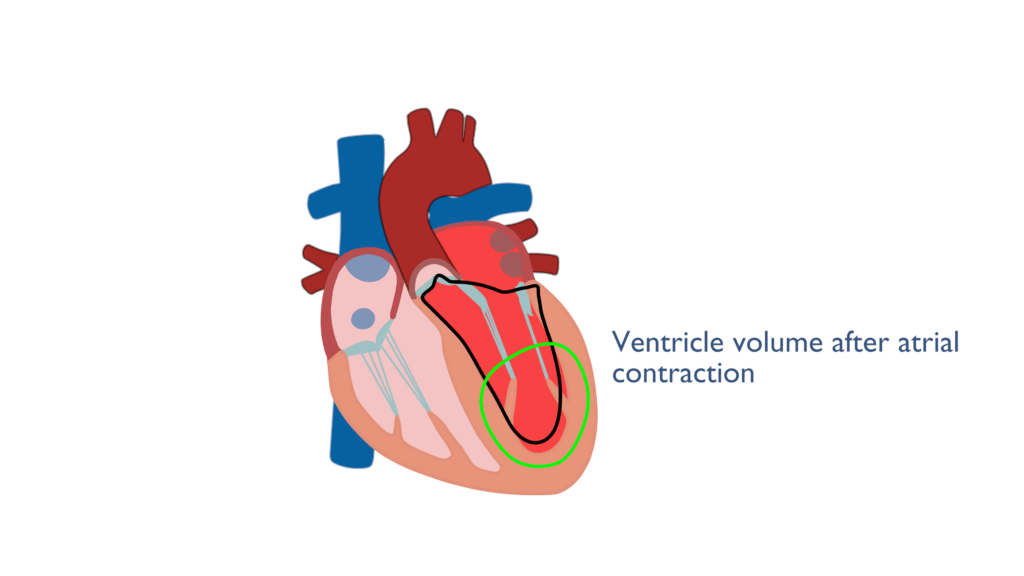
Diastole is when the ventricles are relaxing, causing a drop in systemic pressure, which is from the closing of the semilunar valves to the closing of the cuspid valves. During diastole the heart relaxes and the ventricles fill with blood. End diastolic volume is the amount of blood in the ventricle at the end of ventricular relaxation and just after the atria have contracted to force fill the ventricles.
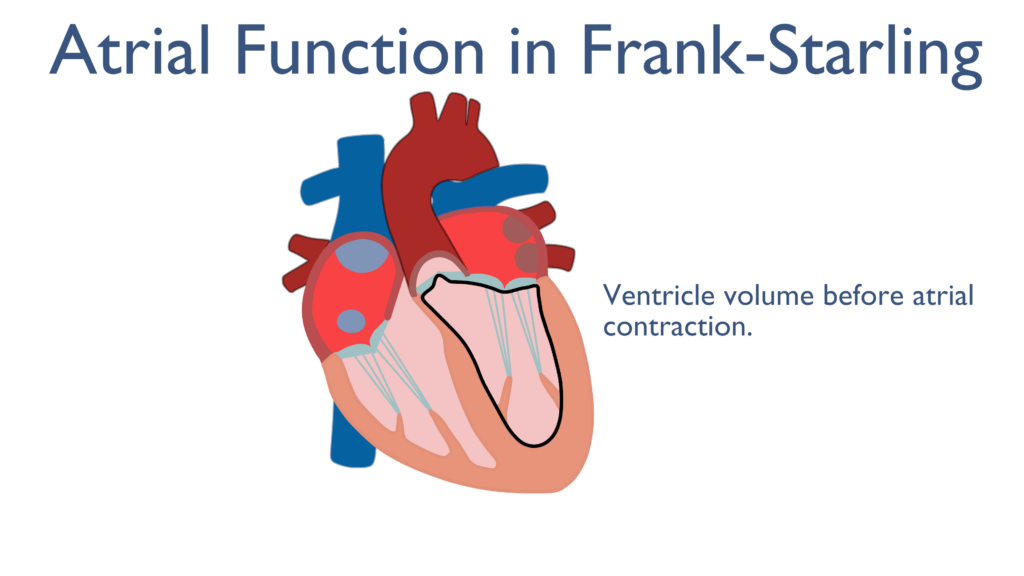
*Atrial Contractions affect on Preload
Just before the end of diastole the atria contract cause a force filling of the ventricles. Once the ventricles have relaxed back to their resting state the atria will contract causing and increase in EDV and the ventricles to expand in diameter. Though the ventricles are relaxed tension builds within the cardiac myocytes caused by the expansion in ventricular diameter. This is important to the Frank Starling Mechanism covered below..
While EDV is not technically considered Preload for the purposes of the topics here, EDV and Preload will be used interchangeably.
Therefore, Preload can be described as the amount of blood within the ventricle directly before ventricular contraction begins.
Preload has a direct relationship with stroke volume. This is to say that when preload increases stroke volume also increases. This is due to the fact that the more blood there is in the ventricle, the more blood the ventricle may pump out.
Frank Starling Mechanism
The Frank-Starling Mechanism describes optimization of contractility through basic functioning of the heart. This mechanism details a relationship between contractility and cardiac myocyte elongation. As the ventricles stretch at the end of filling tension is created within the cardiac muscle cells causing a more forceful contraction.
What the Frank Starling Mechanism truly describes is how Preload effects Contractility. As Preload increases so will Contractility caused by the stretching of the ventricular muscles. Since the atria play a vital role in force filling the ventricles during Preload they play a vital role in the Frank Starling Mechanism.
While stretching the ventricles will cause increases in contractility, it is important to note that there are diminishing returns to this. There is an optimal amount of stretch that will cause the strongest contraction, where anything more than this will actually decrease the strength of the contraction. This is to say that is the ventricle muscle stretches to much the contraction will not be as strong.
Afterload
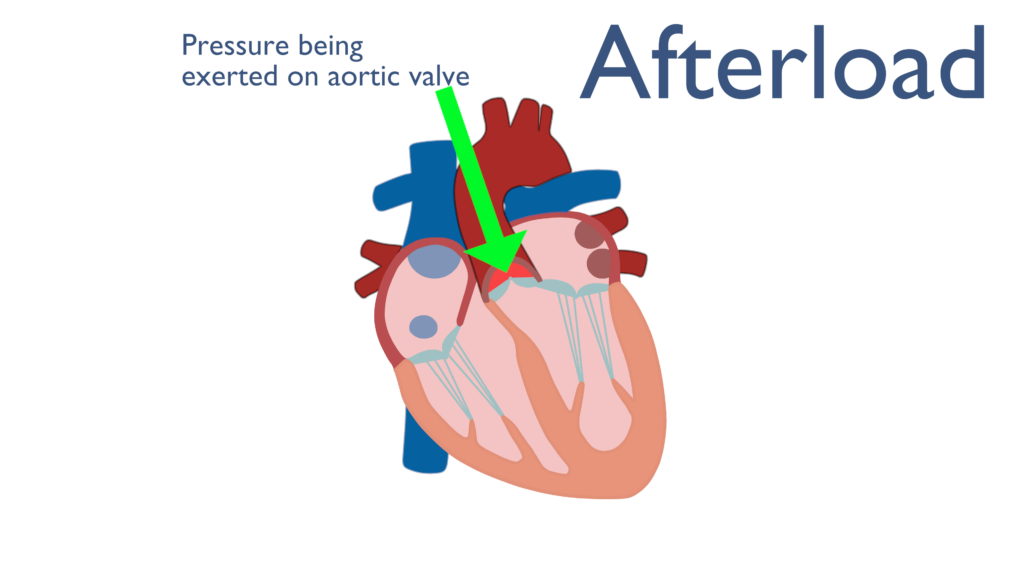
Just like preload, afterload is another overarching term. Norton (2001) describes afterload as “all the factors that contribute to total tension during cardiac myocyte contraction.” This can be more simply stated as all of the factors the contribute to increased pressure within the aorta before ventricular contraction.
Most often afterload is thought of as aortic blood pressure or systemic blood pressure. This is to say that afterload is considered the amount of pressure within the aorta during rest. Another way of thinking of this is that afterload is the amount of peripheral resistance that will impede blood ejection from the ventricle. Again, while this is an oversimplification of afterload, for the purposes of this article it will do just fine.
One way I like to think of this is if the pressure in the aorta is high then the ventricle must push with more force to overcome that pressure. This is a basic concept in the world of mechanics, that is to say fluid or gaseous movement is related to pressure differences. For instance, if we have two containers and we want liquid to flow from one room to another then the liquid in room two must build up a higher pressure than in room one. Lets explore this a little further.
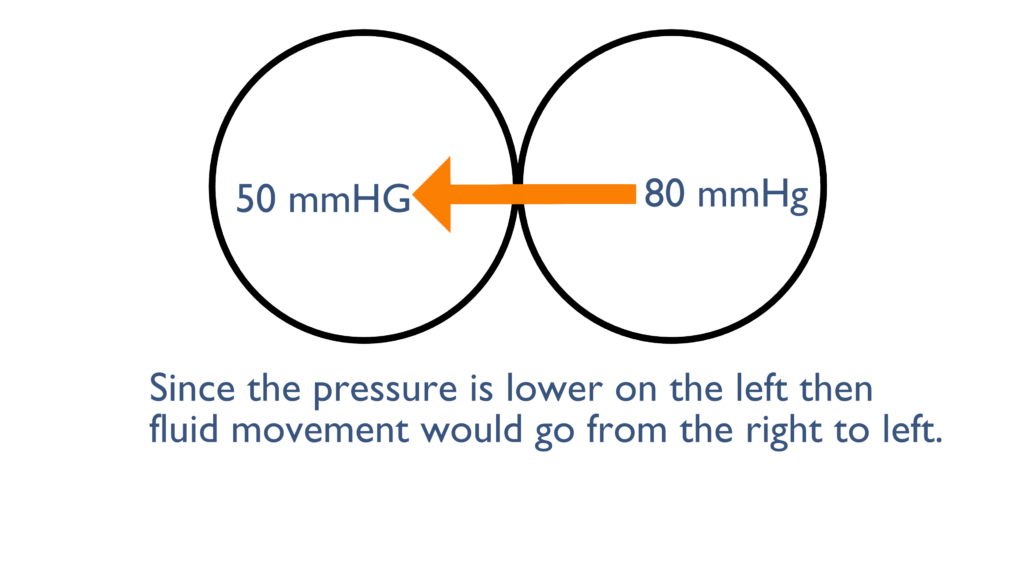
Here, the pressure on the left is less than the right so any movement would go from right to left. Unless there was something blocking the flow such as a valve of some sort.
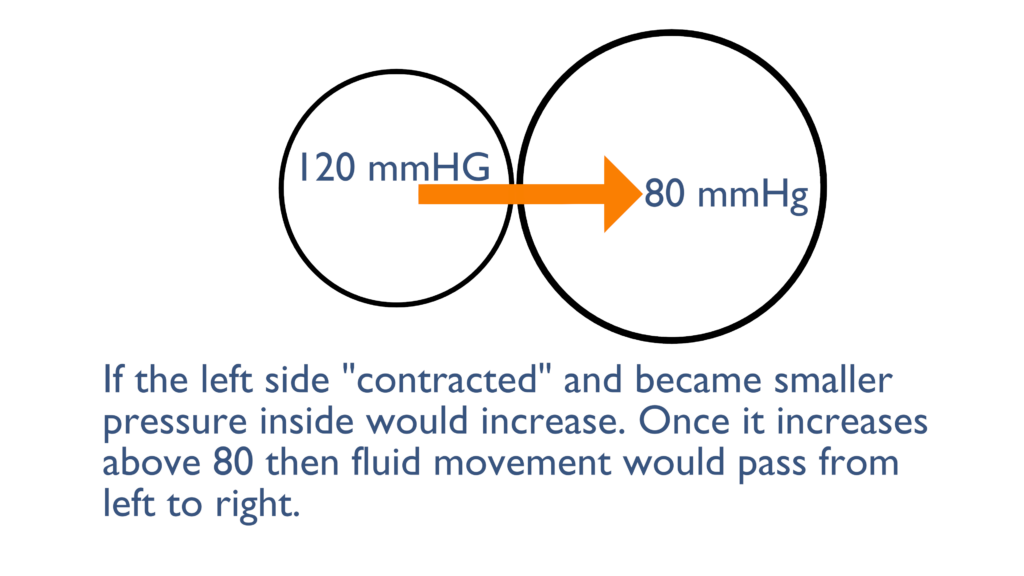
Here we can see that the left container became smaller which increased the pressure inside. Once this pressure increases above the 80 mmHg that is in the right container there will be movement from left to right until each container levels out at about 120 mmHg.
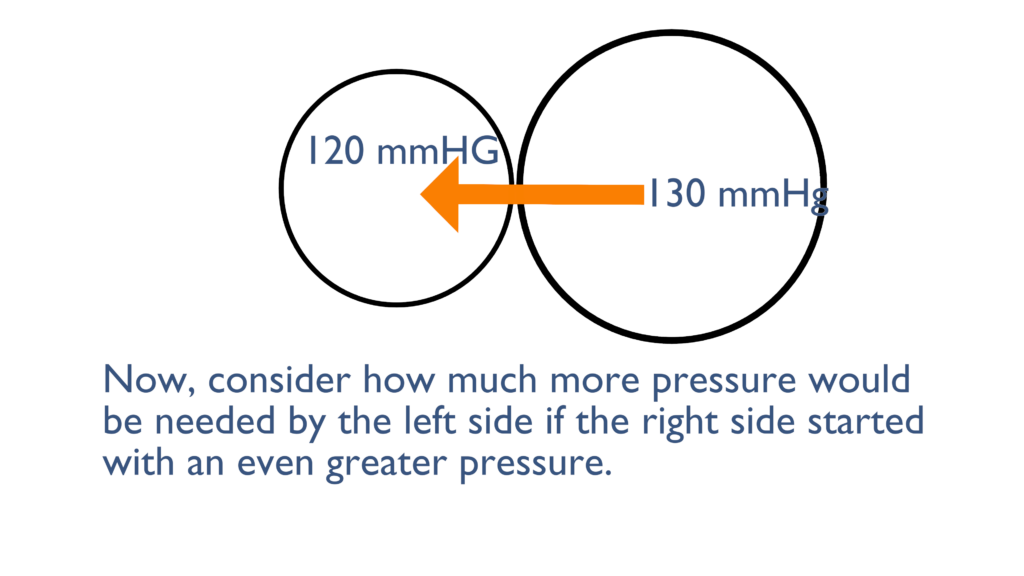
Here we can see that the container on the right originally started with a pressure of 130 mmHg, instead of the 80 mmHg from the first picture. As you can see here the 120 mmHg failed to move the liquid from left to right, because the pressure if still greater on the right side.
It would take an even greater pressure from the left to overcome the pressure on the right and cause movement from left to right.
Now consider the scenarios above and imagine that the container on the left is the ventricle and the container on the right is the aorta. When there is increased pressure in the aorta the ventricles must contract with greater force to overcome that increased pressure and eject blood out of the ventricle.
Afterload has an inverse relationship with stroke volume. This is to say that as afterload increases stroke volume decreases.
Think of this, as pressure beyond the ventricle increases pressure inside the ventricle must increase above and beyond it to push blood through the aorta. Increasing afterload creates greater resistance to blood being ejected from the ventricle which in turn causes the decrease in stroke volume.
Heart Rate
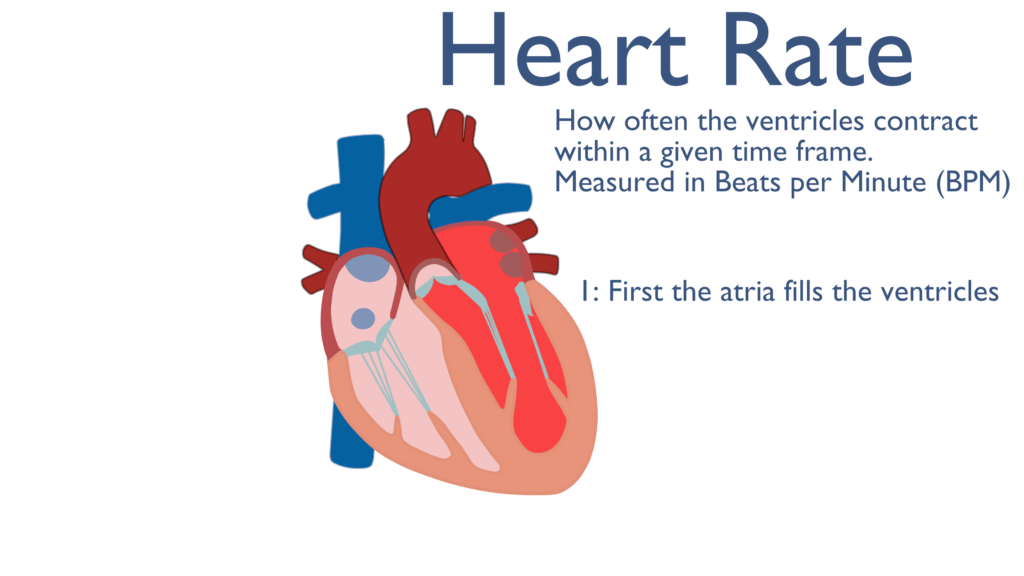
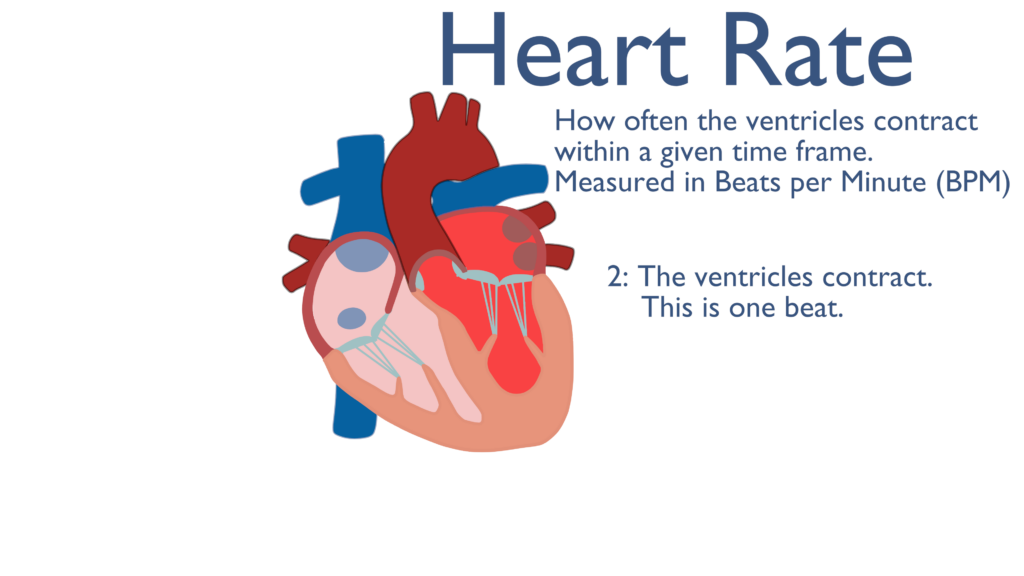
Heart rate is defined as how many times the ventricles contract in a given time period. Heart rate is measured as beats per minute (BPM).
In a health individual, with a normal heart rate, this can be considered how often blood is being pumped throughout the body.
A normal heart rate is roughly 60 to 100 beats per minute.
While heart rate and stroke volume make up cardiac output, heart rate can also have an effect on stroke volume. When heart rate becomes too fast stroke volume will be limited due to changes in preload. If the ventricles cannot fully relax and fill because there is limited time between contractions, preload will be decreased causing a decrease in stroke volume. This relationship between heart rate and stroke volume can further complicate cardiac output in different disease states.
Often we see heart rate increase as a compensatory mechanism when stroke volume is decreased. This is to say when there are factors causing stroke volume to decrease, such as dehydration, heart rate will increase to maintain normal cardiac output. If heart rate is too high we may see an inverse effect where stroke volume is further decreased due to the increase in heart rate, causing a decrease in cardiac output.
So what?
As mentioned earlier, cardiac output may be increased or decreased depending upon stroke volume and heart rate. This is an important concept when considering cardiac output clinically. Think of this, as a bolus of blood leaves the left ventricle it pushes all of the blood in front of it throughout the circulatory system. This means that cardiac output is a main component of circulation and with limited or non-existent cardiac output there is no circulation.
Two of the most important clinical concepts related to cardiac output are symptoms and stability.
Symptomatic vs. Non-symptomatic
In medical terms symptoms are defined as something a patient experiences or feels due to a medical condition.
When cardiac output is altered, such as with various dysrhythmias or cardiac disease, a patient may feel one or more symptoms due to the altered cardiac output.
For instance, is someone presents with new onset atrial fibrillation and they feel dizzy or lightheaded then they are considered symptomatic.
It is important to note if someone is symptomatic. Being symptomatic means something has changed enough to make them feel different. Think of this, if someone normally is used to a cardiac output of 6 L/min and a dysrhythmia is causing a drop in cardiac output to 5 L/min they may begin to feel symptomatic. This does not necessarily mean they are decompensating to the point that they need life saving measures at this exact point in time, but it does warrant a timely response to ensure they do not decompensate to that point.
Symptoms may include but are not limited to:
- Fatigue or feeling weak at rest
- Fatigue during physical activity
- Dizziness or lightheadedness
- Confusion
- Fainting (or near-fainting)
- Shortness of breath
- Chest pain
- Extreme anxiety
- Pale complexion
- Nausea or vomiting
- Palpitations (a feeling that the heart is beating too fast, too strongly, or irregularly)
- Feeling like the heart is racing
- Heavily sweating even at rest
Unstable vs Stable
When we consider stability we are considering is someone is hemodynamically stable. Hemodynamic stability and stability are two terms that are used interchangeably in the context of cardiac disease, so throughout this article we will use the term stability as this is the common term used.
Stability refers to a patients ability to perfuse vital organs, which means our main focus for stability will be the patients blood pressure. If cardiac output is decreased enough to cause a drop in blood pressure (borderline or less than normal limits) then this person is considered Unstable. As blood pressure decreases so does our ability to perfuse vital organs. Stability is the one variable that tells us if we need to act right now or if we have have few minutes to figure out the best course of action.
If a patient is Stable then we know they are still perfusing vital organs which will not imminently lead to organ failure.
If a patient is Unstable then we know they are not perfusing vital organs which will imminently lead to organ failure.
When it comes to monitoring Stability, Mean arterial pressure (MAP) is the standard variable to ensure vital organ perfusion is met and should be monitored at all times when possible.
*Mean Arterial Pressure
Vital organ perfusion requires a MAP of at least 60 mmHg. So when we think of stability we truly should be considering a MAP of greater than 60mmHg.
MAP is defined as the average arterial blood pressure throughout a single cardiac cycle. MAP can be directly or indirectly measured. Direct measurements of MAP are completed with an invasive procedure where an arterial line is placed for hemodynamic monitoring purposes. Indirect measurements of MAP include oscillometric readings while taking an automatic blood pressure or with a simple mathematical equation.
**Oscillometric readings calculated by automatic blood pressure cuffs as they run. With automatic blood pressure machines MAP, based upon this calculation, is displayed alongside the patients blood pressure**
Now that we have covered symptoms and stability consider the following scenarios. The following scenarios may seem quite different, but the cause in each can actually be narrowed down to the same thing. The main cause of the patients condition in each scenario can be boiled down to an alteration in cardiac function leading to a decrease in cardiac output. Before clicking the explanation link think about these scenarios and what may be causing their symptoms.
Scenario 1
What do you think may be happening here?
Once you get them on a cardiac monitor you notice their rhythm to be Supra Ventricular Tachycardia (SVT) with a blood pressure of 110/77.
Why would SVT be causing them to feel dizzy and short of breath?
Scenario 2
What do you think may be happening here?
Once you get them on a cardiac monitor you notice the rhythm to be sinus tachycardia with a blood pressure of 99/65.
What do you think may be causing this person to be in sinus tach?
What is causing this person to feel weak and dizzy?
Scenario 3
On the cardiac monitor this person is noted to be in Ventricular Fibrillation (V-fib) with a blood pressure of 30/15.
Physiologically, what is going on here?
What is causing this person to be pulseless and not breathing?
Remember the old rhyme, defib for V-fib. What is the purpose of the defib?
References
King, J., & Lowery, D. R. (2023, July 17). Physiology, cardiac output. statpearls. Retrieved January 3, 2024 from https://www.ncbi.nlm.nih.gov/books/NBK470455/
Norton J. M. (2001). Toward consistent definitions for preload and afterload. Advances in physiology education, 25(1-4), 53–61. https://doi.org/10.1152/advances.2001.25.1.53