Interpreting ECG Strips is the foundation of this ECG course. As this course progresses we will take a look at dysrhythmias which are abnormal cardiac rhythms. To be able to identify dysrhythmias we should understand how to interpret a 6 second ECG strip.
When we print out an ECG strip to interpret, most commonly, we are printing out a 6 second strip. This means we are only seeing a small portion of cardiac function, yet we are able to get an appropriate picture of what is going on.
Below we will detail steps to interpreting a 6 second ECG strip.
1. Assess the rhythm.
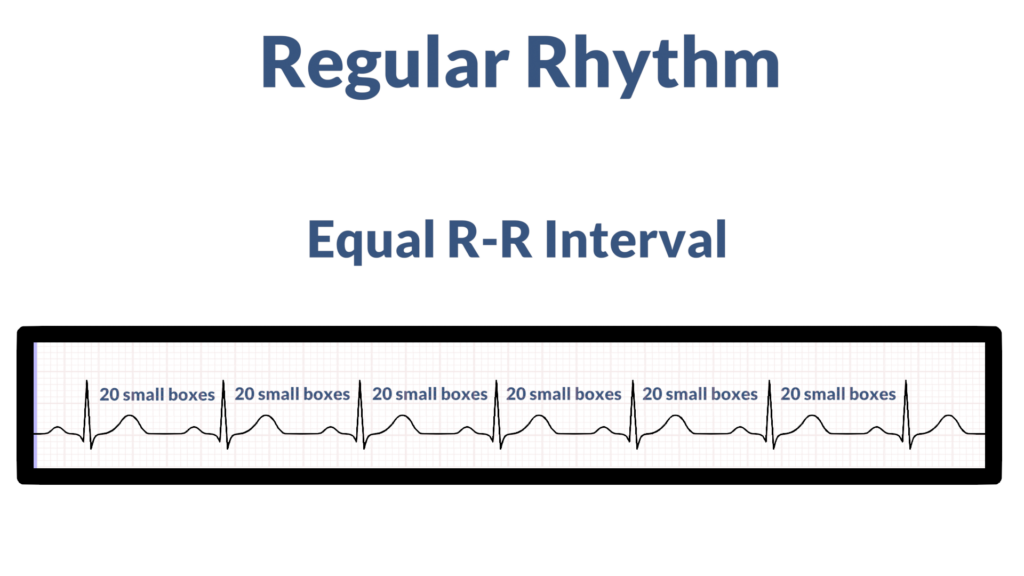
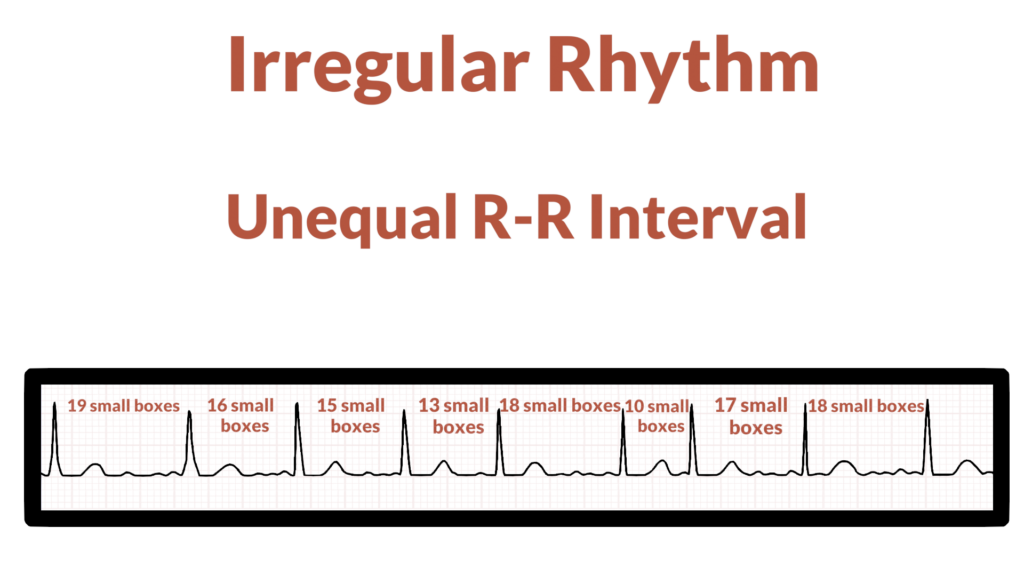
First, assess if the rhythm is regular or irregular. To do this look at the R-R interval. The rhythm is considered regular if the R-R spacing is consistent, and it is considered irregular is R-R spacing is inconsistent.
2. Assess the rate.
Next, assess heart rate. Here are the most common ways to do this:
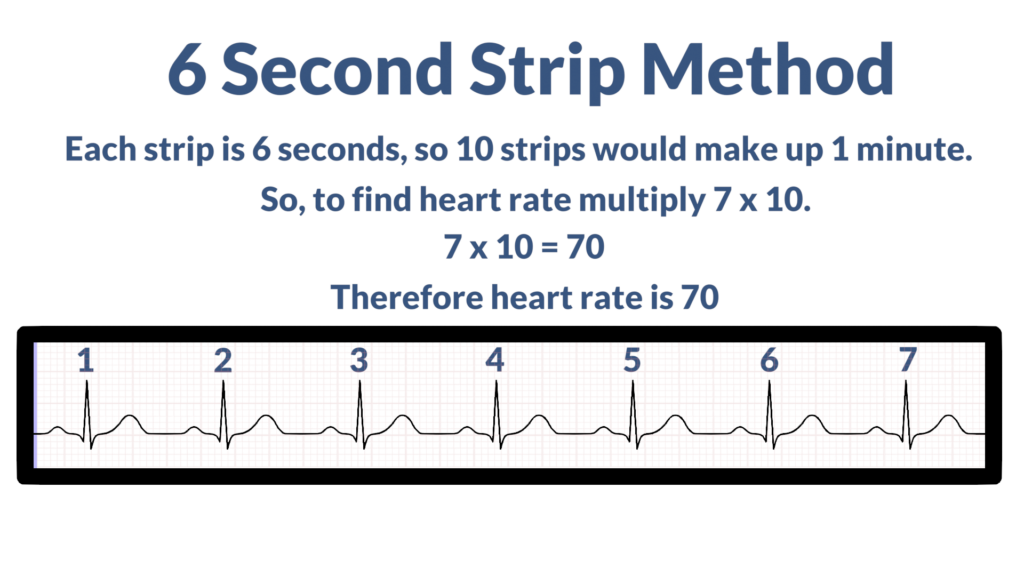
- 6 Second Strip Method
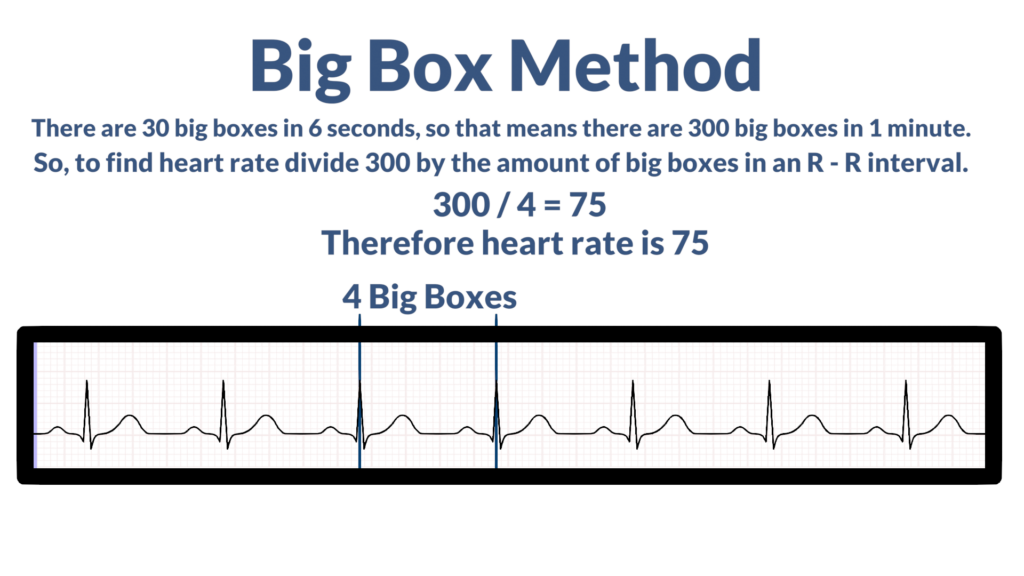
- Big Box Method
- Small Box Method
The 6 second strip method constitutes counting the R waves in a 6 second strip and then multiplying by 10 to get heart rate.
The Big Box Method consists of counting the amount of big boxes in an R-R interval and then dividing into the number of big boxes in a minute. There are 30 big blocks in a 6 second strip, so that means that 1 minute would hold 300 big blocks. So, for this method we would divide 300 by the amount of big blocks between two R waves.
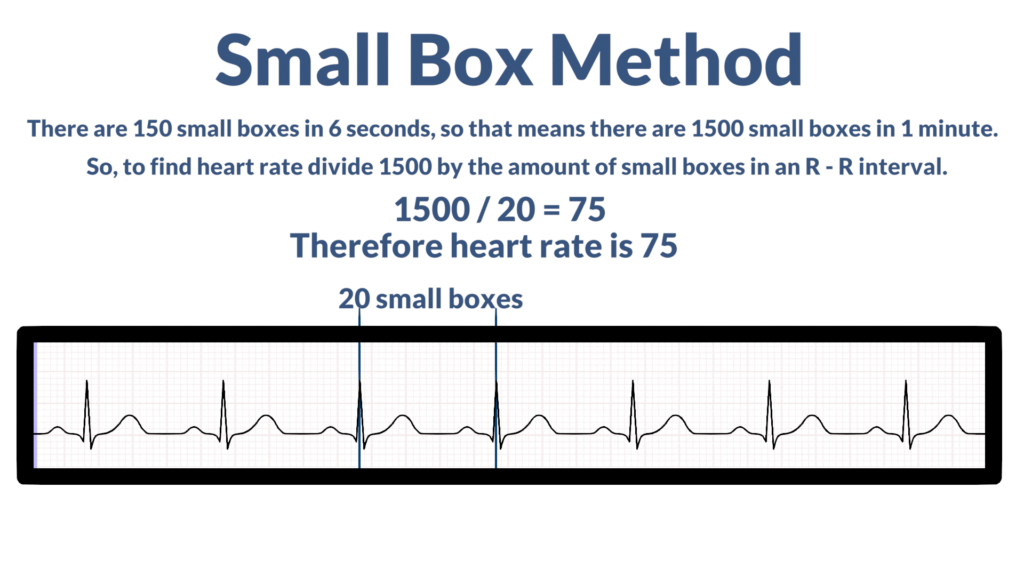
The Small Box Method consists of counting the number of small boxes in an R-R interval and then dividing by the number of small boxes in a minute. There are 150 small boxes in a 6 second strip, so that means that 1 minute would hold 1500 small boxes. So, for this method we would divide 1500 by the amount of small blocks between two R waves.
3. Assess the P waves and PR interval.
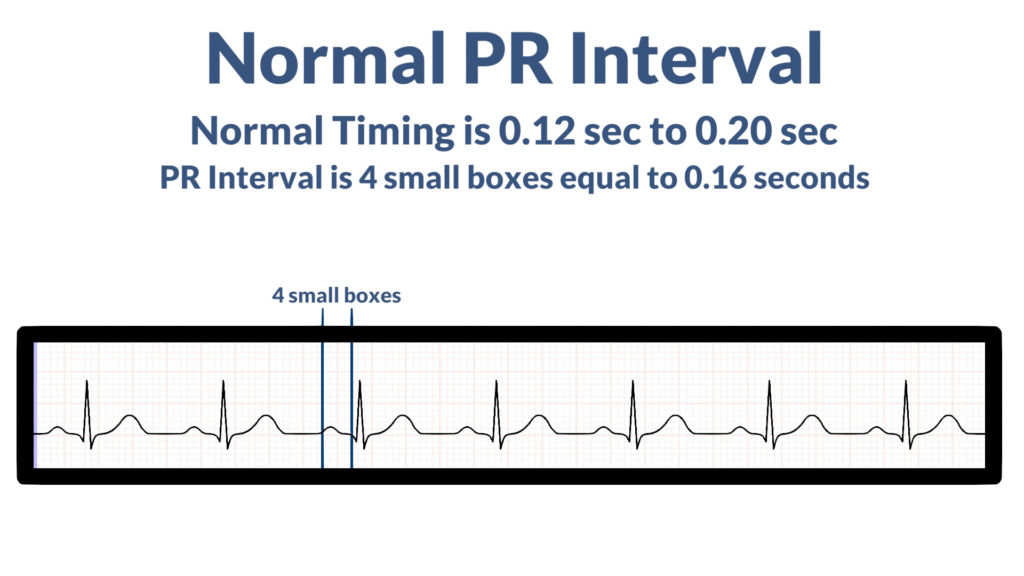
Here the focus is making sure all P waves look the same and to assess the PR Interval (PRI). Focus on these questions:
- Do all P waves deflect in the same direction?
- Do all P waves have the same morphology (form)?
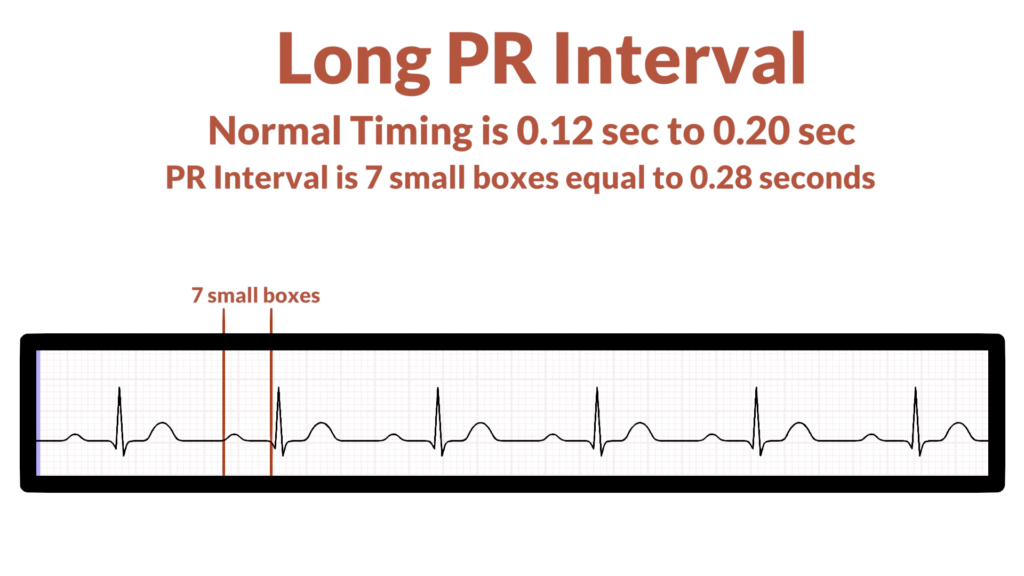
- Is the PRI within standard limits? (PRI standard limits are within 0.12 seconds to 0.20 seconds, or, 3 to 5 small boxes).
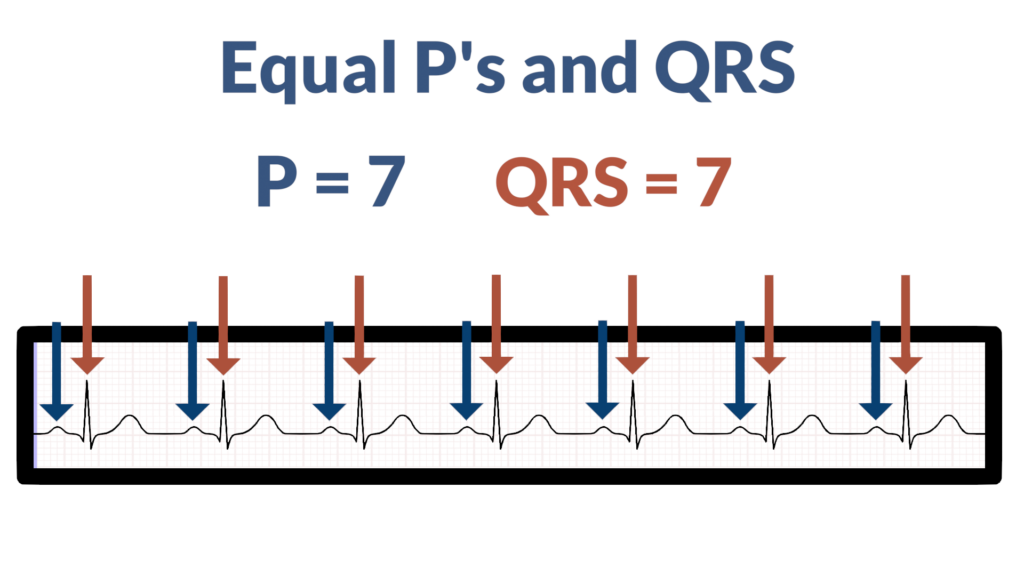
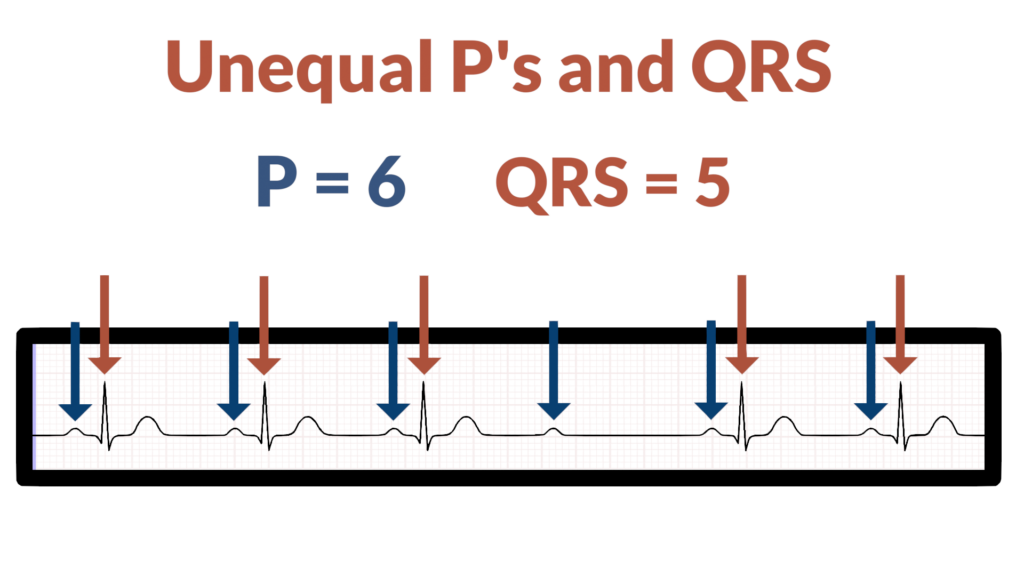
4. Assess atrial and ventricular rates.
Here we are looking to see if the atria and ventricles are working together. To do this check for two things:
- Are there equal numbers of P’s and QRS’s?
- Does each QRS have a P wave directly before it?
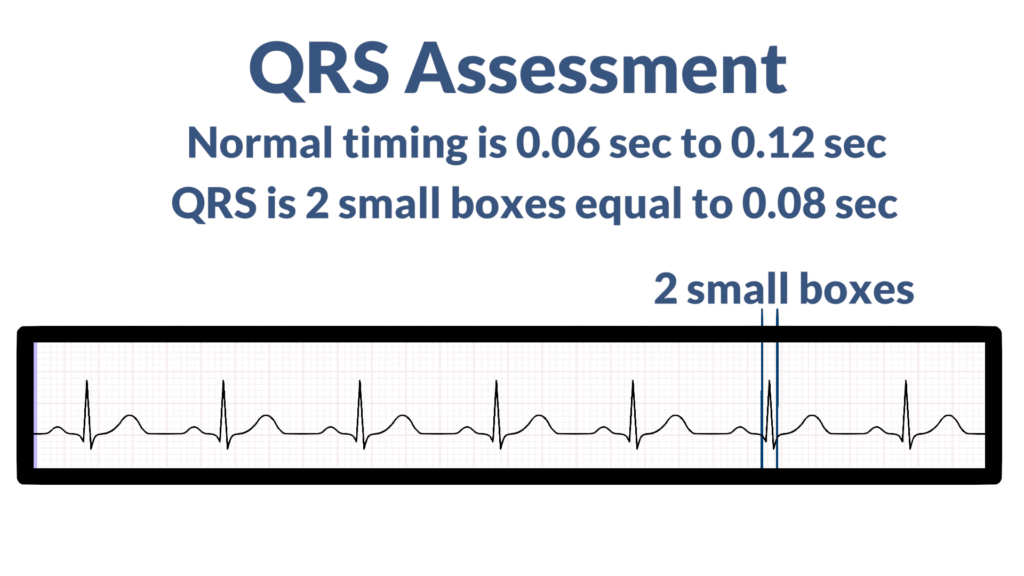
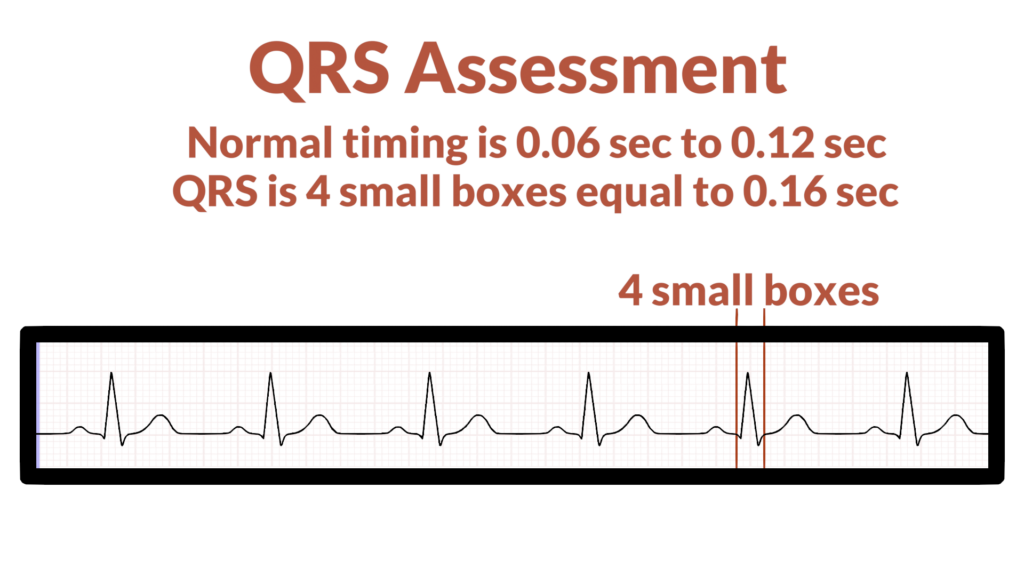
5. Assess the QRS.
Now, assess the QRS complexes.
- Do all QRS complexes deflect in the same and expected direction?
- Do all QRS complexes have the same morphology (form)?
- Is the QRS complex within standard limits? (QRS complex standard limits are within 0.06 seconds to 0.12 seconds, or, 1.5 to 3 small boxes).
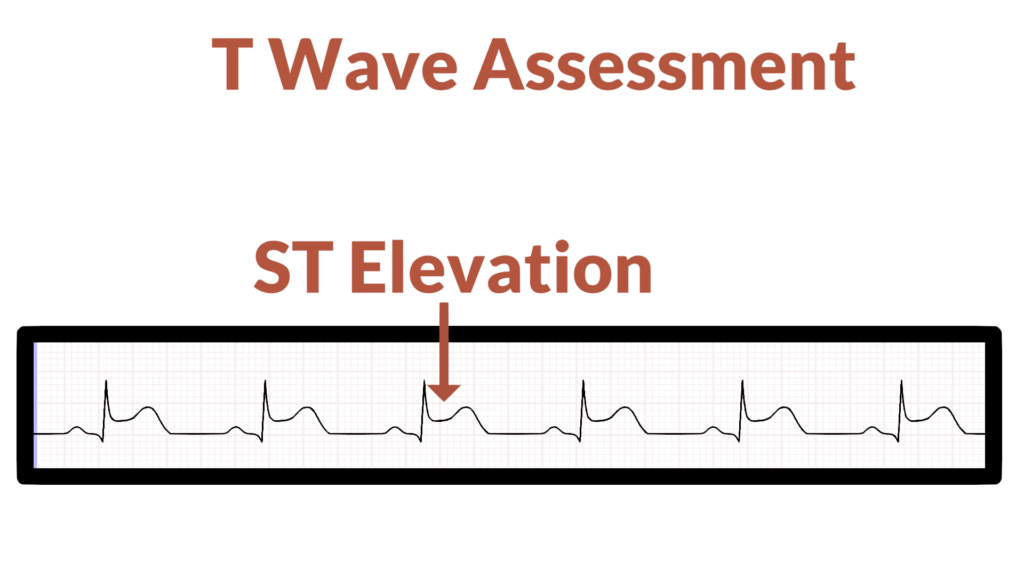
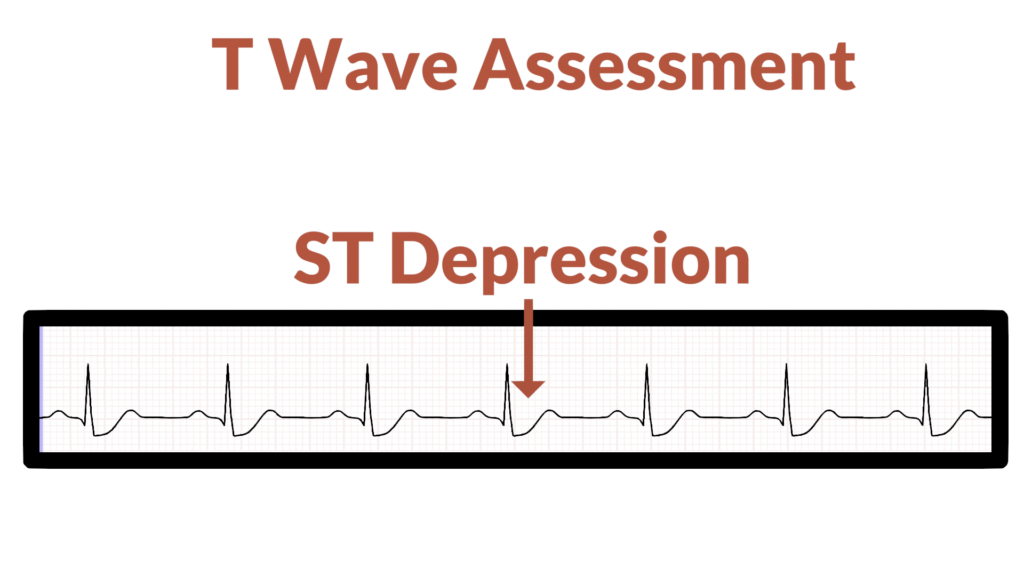
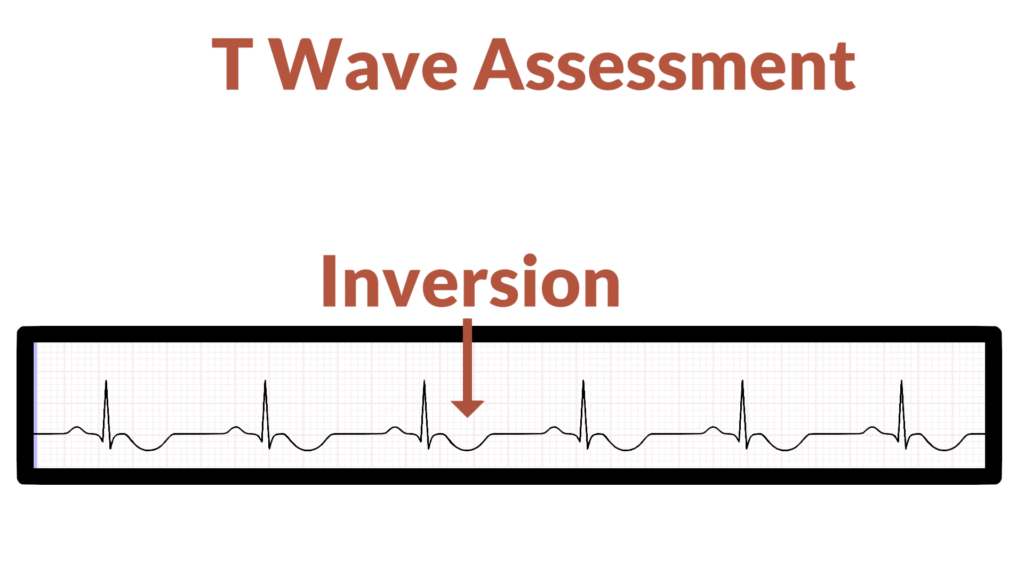
6. Assess the T waves
Next, do the T Waves look normal?
- Is there any ST Segment Elevation? (STEMI)
- Is there any ST Segment Depression?
- Are the T Waves inverted?
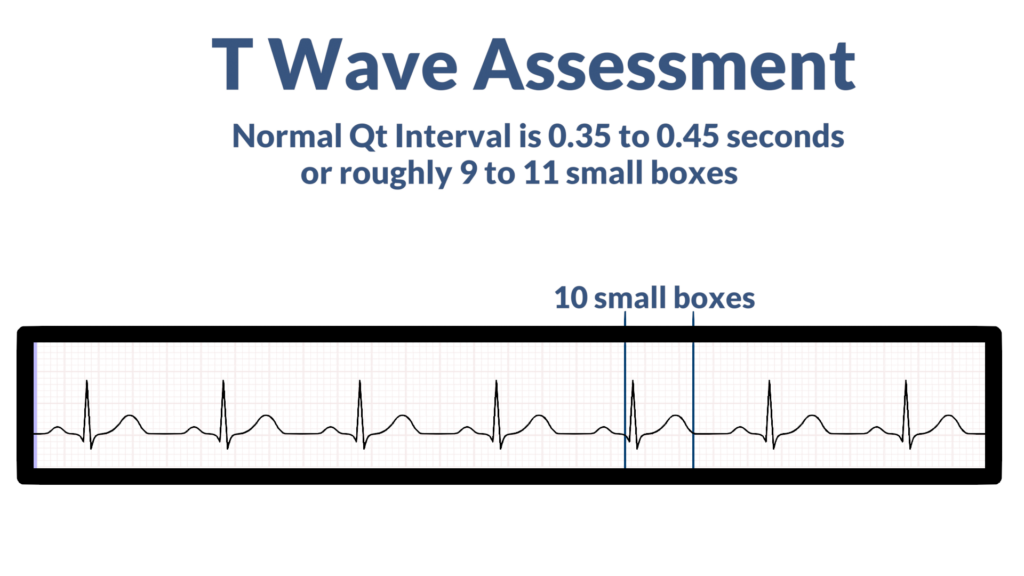
- What is the Qt Interval? (Normal Qt interval is within 0.35 seconds to 0.45 seconds, or, 9 to 11 small boxes).
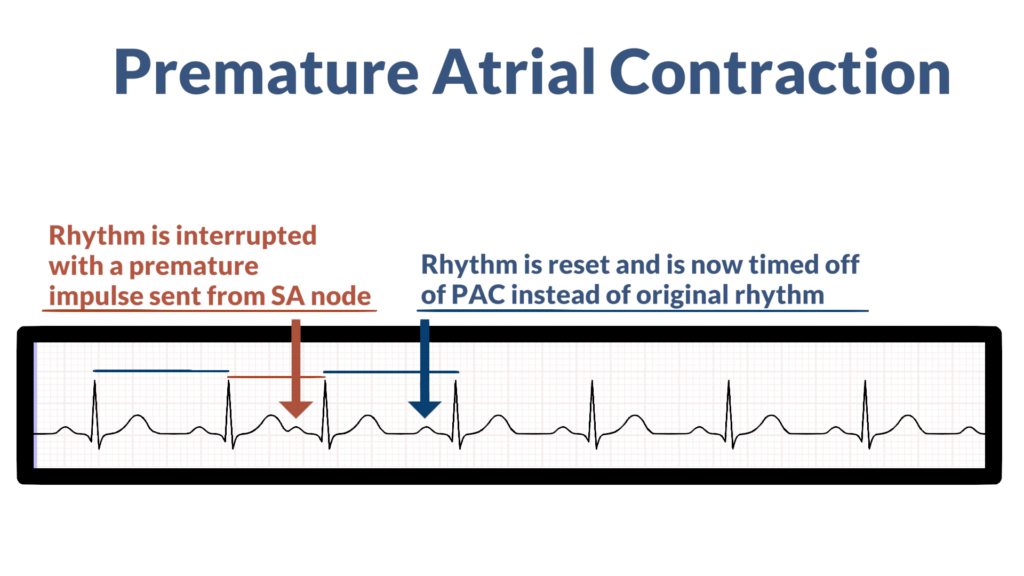
7. Assess for Ectopy.
Lastly, check for ectopy. Do you see any ectopic beats within the strip? The two forms of ectopic beats are:
- Premature Atrial Contraction (PAC).
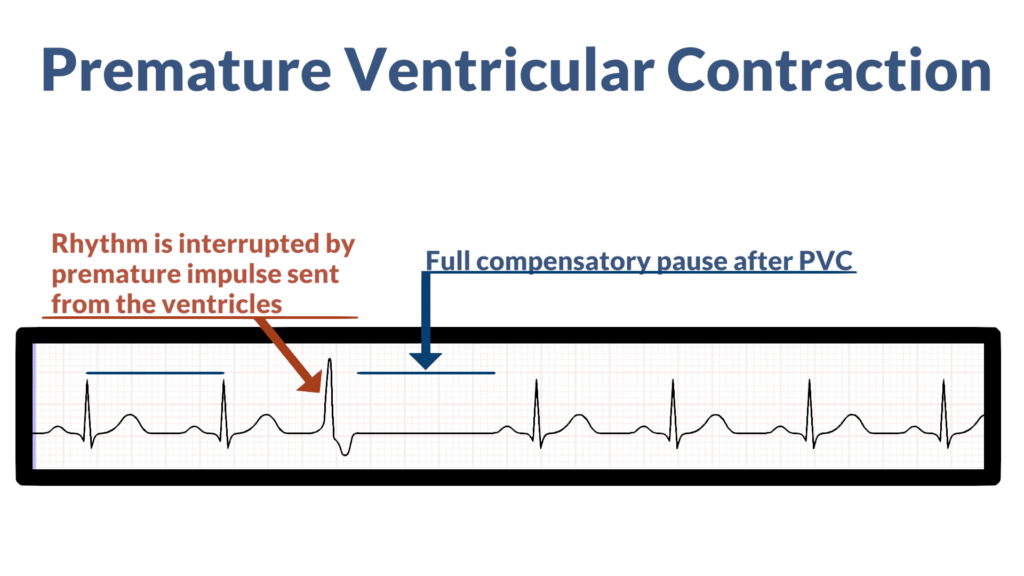
- Premature Ventricular Contraction (PVC).
Read Next: Dysrhythmias